It’s here, and it’s rich
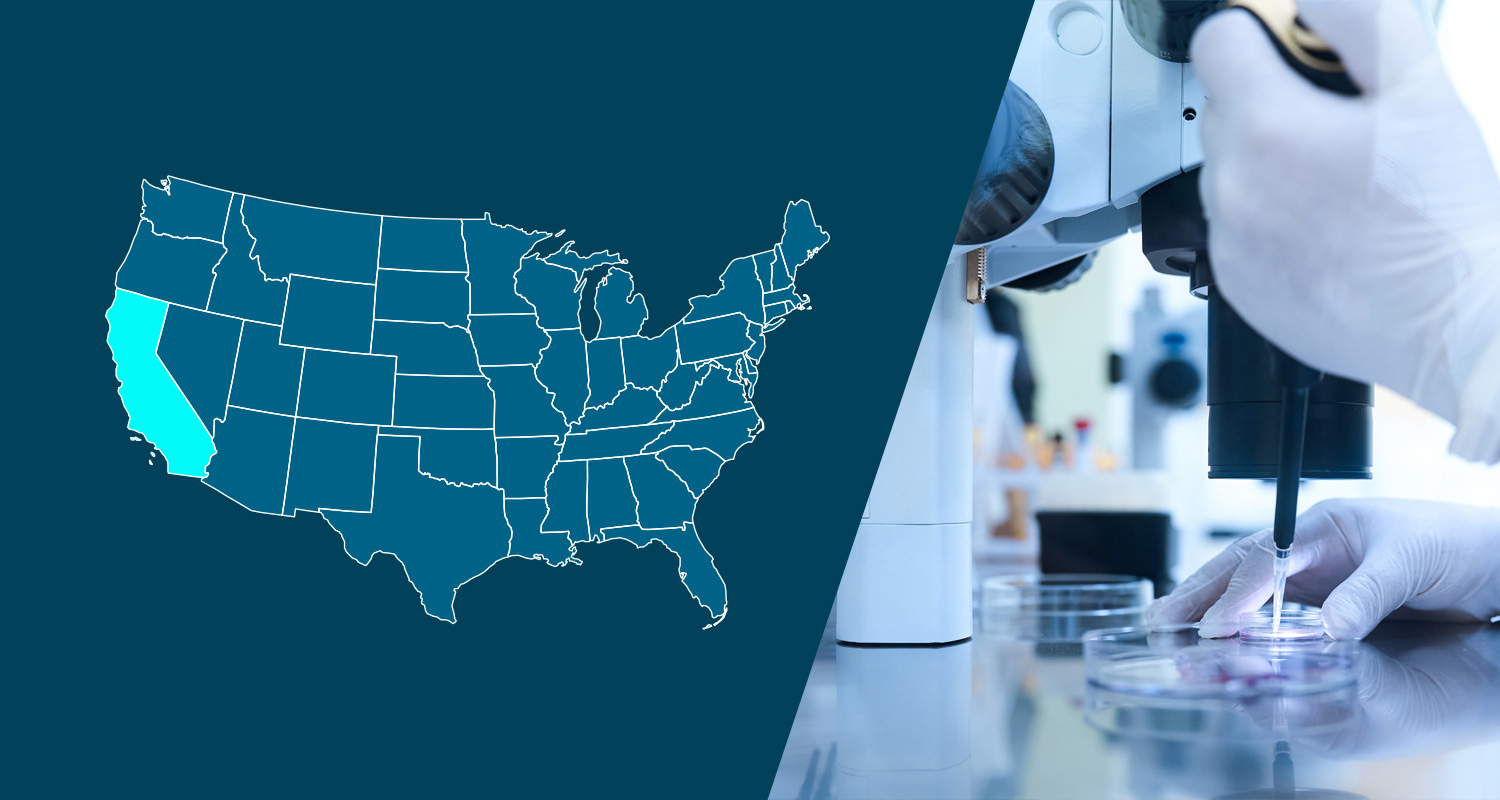
The 2018-2019 edition of our annual benchmarking report is the most detailed and comprehensive to date. Featuring in-depth data collected from over 680 U.S.-based companies ranging from small to large, HR and Finance professionals like you can use this valuable tool to inform their benefits strategies, people programs and policies, and risk mitigation. Weighted toward the technology space (84% of survey participants) and tech hub states of California and New York, the report sheds light on the investments some of the most savvy, people-driven employers are making to attract and retain the talent they need to execute their mission.
What’s new this time around
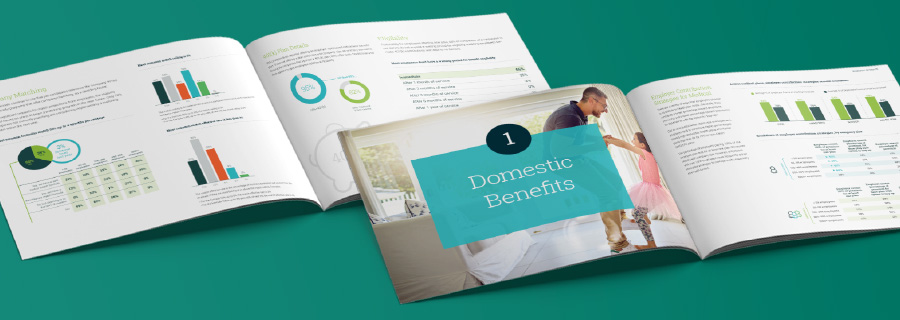
This year’s report now features six sections. Not only have we expanded the sections around domestic benefits, global benefits, employee wellbeing, HR policies, and 401(k) retirement plans, we’ve introduced an all-new section focused on risk management and business insurance. While employee benefits protect your people and their families from the unexpected, corporate insurance protects your shareholders, customers, and the public from the same. Survey participants provided insights on risk mitigation strategies as well as the kinds of policies they procure and how much they spend on those policies relative to their financial position.
Deep dives and insights galore
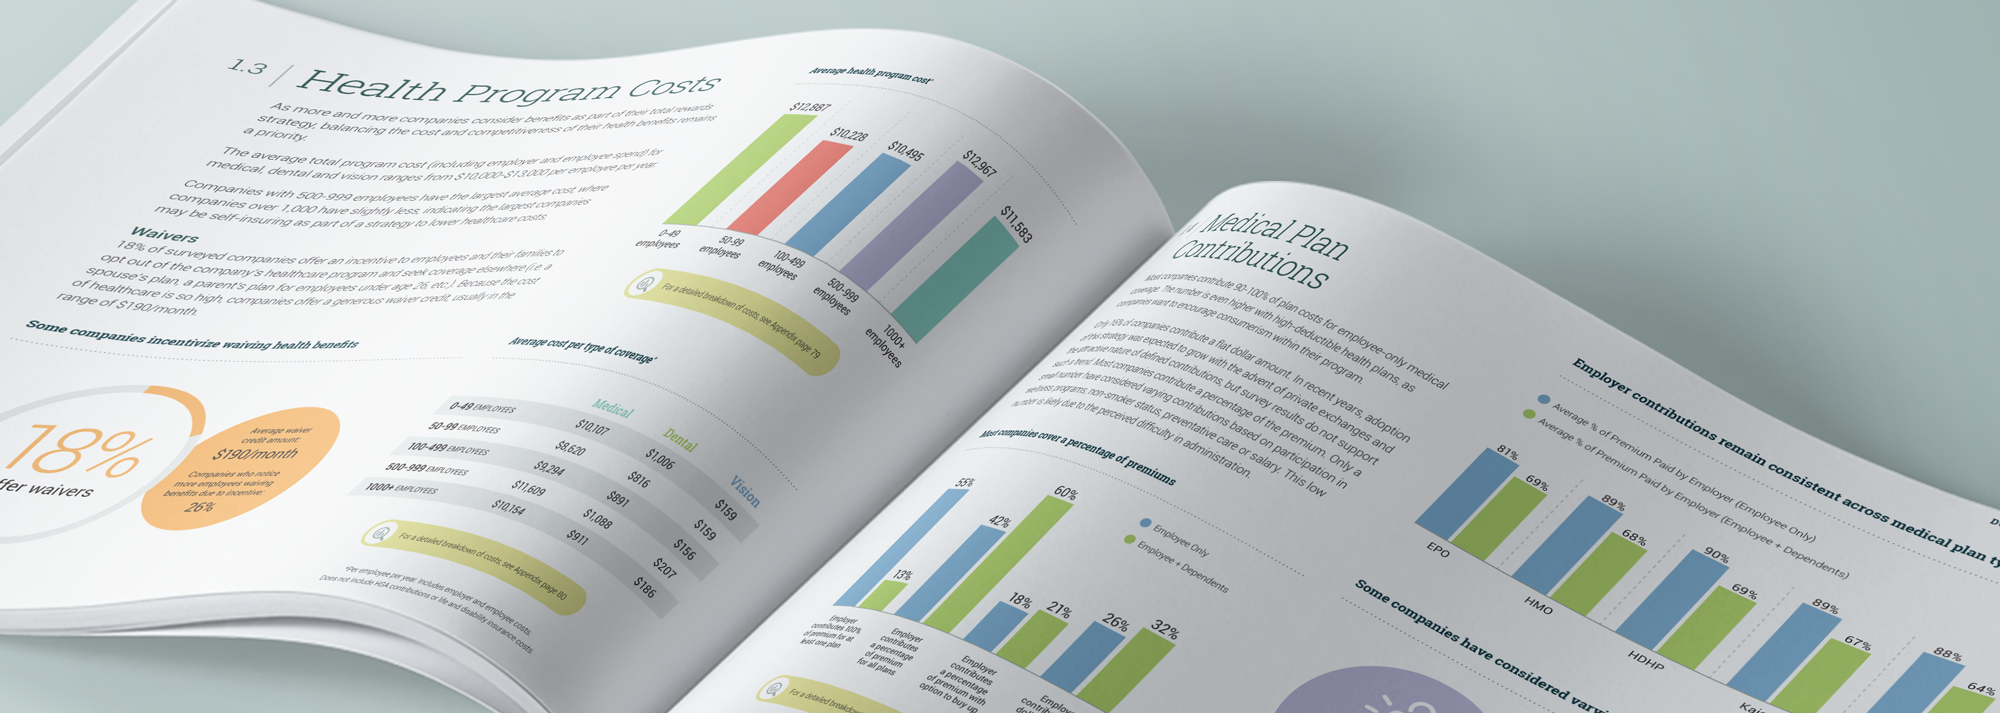
With a more stringent approach to filtering and qualifying the data we collected, this year’s report gets a precise look at how companies are making decisions to reduce costs or better meet the needs of their workforce. For instance, in the healthcare space, the prevalence of high-cost claims is on the rise along with increasing premiums and drug prices. According to our data, high-cost claims over $500,000 have increased 145% over the last three years. We explore the reason given the relatively healthy demographics of tech companies.
On another note, our report confirms that many of today’s most influential companies are redefining their values and prioritizing efforts to reduce unconscious bias and embrace a workforce that is inclusive of races, genders, ages, religions, disabilities, and sexual orientations – with Diversity & Inclusion programs gaining traction at 70% of companies. These are just some of the interesting findings from the six chapters in this years’ report.
Your guide to a happier and healthier workforce
While the full report is only available to survey participants, we’d love to connect you with a consultant to review the key trends and hot topics we found with this year’s data. To see how your company stacks up against your competition, and to sign up to participate in next year’s survey, please fill out the form on sequoia.com/benchmark.